1. Annual income presidents
The data for this assignment are listed in the Excel file Annual income presidents.
A survey of 80 randomly selected companies asked them to report the annual income of their presidents. Assume that incomes are normally distributed with a standard deviation of 30,000 dollar.
a. Determine the 90% confidence interval estimate of the annual income of all company presidents. Interpret the statistical results.
b. What would happen to the interval width if we take the 95% confidence interval?
c. What would happen to the interval width if 250 randomly selected companies had been asked. Explain your answer.
2. Rule of thumb
If the variable  is normally distributed with mean
  and standard deviation
  , in brief
  , sometimes the following rule is used: there is about
  % chance that an observation
  is in the interval
 ![[\mu-\sigma,\mu+\sigma]](https://4mules.nl/wp-content/ql-cache/quicklatex.com-e237c3a3d80e518f3d57e173a3c24b42_l3.png "Rendered by QuickLaTeX.com") and about
and about  % chance that it will lie in the interval
 ![[\mu-2\sigma,\mu+2\sigma]](https://4mules.nl/wp-content/ql-cache/quicklatex.com-aae26872aa387feb14f4b7ca19999197_l3.png "Rendered by QuickLaTeX.com") .
.
How would you verify this rule?
3. Family net income
According to the Statistical Abstract of the United States, 2000 (Table 764), the mean family net worth of families whose head is between 35 and 44 years old is approximately 99700 dollar. Assume that the family net worth is normally distributed with a standard deviation of 30000 dollar.
a. Find the percentage of families of this type with a head between 35 and 44 years old and a net worth greater than 150000 dollar.
b. Approximately how many percent of this type of family has a net worth between 70000 dollar and 130000 dollar?
c. Compute the net worth W if it is known that only 1% of this type of family has a net worth greater than W.
Solution.
a. We have  and thus
  . Excel only computes the
  cumulative values.
  and thus
  .
.
b. We compute:

 .
.
We also may make use of the ‘rule of thumb’ that about 68% of the observations lie in the interval  , which is approximately the case.
c. We have to compute  from
from  . This can be done by the using the inverse normal distribution function which yields
  .
.
4. Christmas certificates
The data for this assignment are listed in the Excel file Christmas certificates.
An increasing number of people are giving gift certificates as Christmas presents. To measure the extent of this practice, a random sample of people was asked (survey conducted December 26-29) whether they had received a gift certificate for Christmas. The responses were recorded as 1 = No and 2 = Yes.
a. Compute the fraction  of people that have received a certificate for Christmas.
b. Estimate with 95% confidence the proportion of people who receive a gift certificate for Christmas.
Solution.
a. Using Excel we find  .
.
b. The confidence interval is  where
where  and
and  . So, LCL
  and UCL
  .
.
5. Japanese bulk carriers
The data for this assignment are listed in the Excel file Japanese bulk carriers.
In this file you find a sample of (2000-2004) prices for Japanese secondhand handy size bulk carriers that are at least 11 years old. Assume that these prices are normally distributed with a standard deviation of 3,000,000 dollars.
a. Compute the 95% confidence interval estimator for the average price of a Japanese secondhand handy size bulk carrier. You may do the calculations manually or using Excel.
b. A potential buyer wants more confidence than 95%, e.g., 99%. What will happen with the confidence interval?
c. Another potential buyer finds 95% confidence sufficient, but finds the interval too wide. He wants a narrower 95% confidence interval. What should he do to accomplish this?
Solution.
a. The 95% confidence interval estimator for the population mean is  , with
  , ,
, ,  so the confidence interval is
  . Excel will give the same result.
b. He should make the confidence interval wider. The wider the interval, the more chance that the interval will contain the population mean. You can check this effect by replacing  by e.g.,
  , which is larger than . This will make the interval wider.
c. Take a look at the formula and find that the confidence interval will get less wide by increasing  that is, the sample size of the ships.
6. Behavior of shoppers
The data for this assignment are listed in the Excel file Behavior of shoppers.
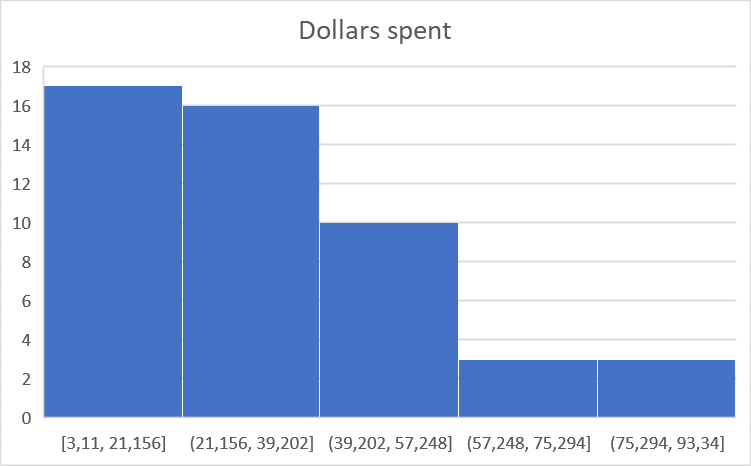
A marketing consultant observed a sample of 50 shoppers at a supermarket. One variable of interest was how much each shopper spent in the store. The given data (in dollars) are arranged in increasing order.
a. Are the data normally distributed? One can determine this by creating a histogram.
b. Explain why the sample mean can be assumed to be normally distributed even when the population is not normally distributed.
c. Compute the 95% confidence interval of the population mean.
Solution.
a. A histogram created by Excel shows that by far most of the data are around 20, and the data are not symmetrically distributed, so the data are not normally distributed.
b. Based on the Central Limit Theorem we may assume that  is normally distributed even when the original population is not, provided that the sample is large enough. This is generally the case if
  .
.
c. Excel (One Sample |  ) computes the 95% confidence interval: (28.536, 40.869).