Summary and examples
The following formula is an example of an exponential function:
![]()
where ![]() . The name exponential function is used if the exponent contains the independent variable
. The name exponential function is used if the exponent contains the independent variable ![]() . The function above is always positive because the power of a positive number is always positive.
. The function above is always positive because the power of a positive number is always positive.
This function can be extended, for example:
![]()
![]() ,
, ![]() ,
, ![]() ,
, ![]() and
and ![]() are constants and are sometimes called parameters.
are constants and are sometimes called parameters.
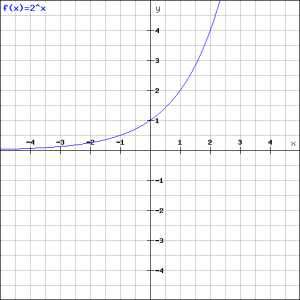
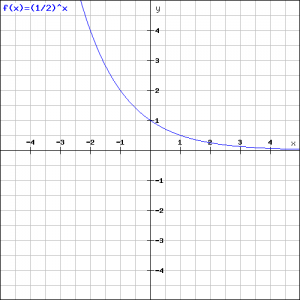
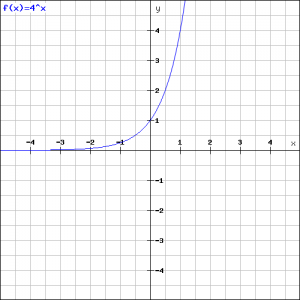
We will draw the graphs of two exponential functions.
The left graph corresponds to the function:
![]()
and the right graph corresponds to the function:
![]()
Both graphs are each other's mirror, they are mirrored in the ![]() -axis. We can easily show this algebraically:
-axis. We can easily show this algebraically:
![]()
and this is the mirror in the ![]() -axis of the function:
-axis of the function:
![]()
We will bring together in one figure some functions of the type :
![]()
namely:
![]()
![]()
![]()
See the figure.
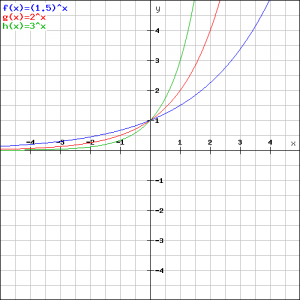
We first notice that all graphs go through the point ![]() . This is because we have for
. This is because we have for ![]() :
:
![]()
for each ![]() .
.
Furthermore we can easily explain that the fastest increasing graph (green) corresponds to the function:
![]()
and the least fast increasing graph (blue) to the function:
![]()
We also see that all three graphs converge to ![]() when
when ![]() will be more and more negative. In other words, if:
will be more and more negative. In other words, if:
![]() then
then ![]()
The graphs will not reach but only approach the ![]() -axis. Such a line, in this case the
-axis. Such a line, in this case the ![]() -axis, is called an asymptote.
-axis, is called an asymptote.
Now we look at a somewhat more complex exponential function:
![]()
In the figure the graph of this function is outlined.
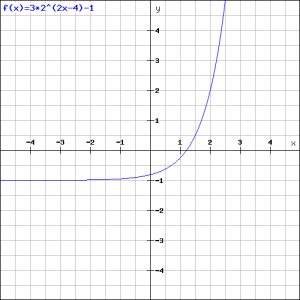
If ![]() we get:
we get:
![]()
and the figure shows that this seems to be correct.
If we want to know where this function intersects the ![]() -axis, then we have to take
-axis, then we have to take ![]() . Then we get the following exponential equation (see also Exponential equations):
. Then we get the following exponential equation (see also Exponential equations):
![]()
![]()
When we apply the logarithmic function to both the left- and right-hand side (see also Logarithmic functions and graphs), we get:
![]()
![]()
![]()
and we can see this in the figure. (Often it is not necessary to calculate an exact number and it is sufficient to get a result with an logarithm).
Finally we see that if ![]() will get more and more negative, so if
will get more and more negative, so if ![]() the first term of the function approaches
the first term of the function approaches ![]() and the graph approaches the value
and the graph approaches the value ![]() . We can see this in the figure.
. We can see this in the figure.
Example 1
Draw the graph of the function:
![]()
We try to find a number of points which enables us to draw the graph.
For ![]() we get respectively:
we get respectively:
![]()
![]()
![]()
![]()
![]()
and thus we can draw the graph:
Voorbeeld 2
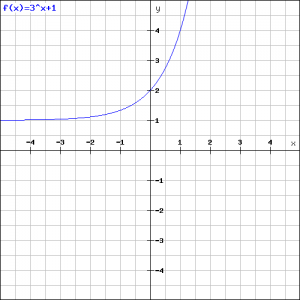
Draw the graph of the function:
![]()
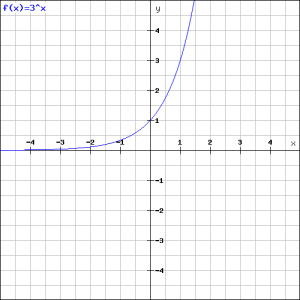
We consider the function:
![]()
Next, we can draw the original function by adding ![]() to the result.
to the result.
We try to find a number of points which help us to draw the graph.
For ![]() we get respectively:
we get respectively:
![]()
![]()
![]()
![]()
![]()
See the figure.
We get the final result by adding ![]() to this graph:
to this graph:
Example 3
Draw the graph of the functions:
![]()
![]()
and calculate the intersection point.
We roughly know the graphs, see above. In the figure below they are drawn exactly. Verify which graph corresponds to which function.
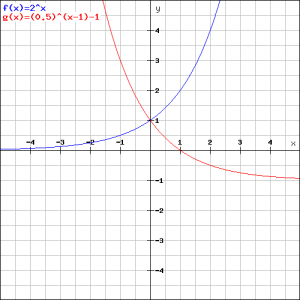
In order to calculate the intersection point of both graphs we have to solve the equation:
![]() .
.
We have to work out the equation (see also Exponential equations):
![]()
![]()
![]()
![]()
To derive the third equation from the second, both sides are multiplied by ![]() , by which we get a quadratic equation in the variable
, by which we get a quadratic equation in the variable ![]() , see also Quadratic equations (abc-formula) and Quadratic equations (factorizing).
, see also Quadratic equations (abc-formula) and Quadratic equations (factorizing).
Now we get an alternative equation by taking:
![]()
and get:
![]()
We can factorize this equation:
![]()
which has the solution:
![]() or
or ![]()
The first solution is no real solution for ![]() because an exponential function cannot be negative. The other solution yields:
because an exponential function cannot be negative. The other solution yields:
![]()
![]()
Thus both graphs intersect in ![]() , which could be expected from the figure.
, which could be expected from the figure.

