Linear regression is used to examine the linear relationship between two variables  and
and  . The dependent variable is and is the independent variable. Such a linear relationship is expressed by the following formula:

 is an error variable.
To define the relationship between and we need to know the value of the coefficients  and
and  which are population parameters.
Examples of such linear relations are:
- Relation between hours spent at part-time jobs
 and grade point averages
  ;
; - Relation between costs for repairs and the age of machines ;
- Relation between the number of hours television watching and total debt ;
- Relation between the time between movies and the sales of popcorn, soft drinks .
We distinguish two types of models.
Deterministic and probabilistic models
An equation or set of equations that allow us to fully determine the value of the dependent variable from the values of the independent variables is called a deterministic model.
A method used to capture the randomness that is part of a real-life process:

 is constant.
As an example we will look at the relationship between the score of the popular GMAT test and MBA scores. We consider a linear univariate regression model (i.e. there is only one independent linear variable). Program managers of MBA programs want to improve the MBA scores of their programs (MBA scores on a scale from 0 to 5) and thus want to select the best students.
They consider the introduction of a GMAT test (Graduate Management Admission Test) (GMAT scores range from 200 to 800) as one of the admission criterions and prefer students with the highest GMAT scores.
If there would be an exact linear relation between MBA scores and GMAT scores, the graph of such a relation would be a straight line with a positive slope. In this deterministic case the linear relation would be:

: the MBA score, ![y\in[0, 5]](https://4mules.nl/wp-content/ql-cache/quicklatex.com-aea44614350a59c8cdecfb100b460feb_l3.png "Rendered by QuickLaTeX.com") : the GMAT score (in 100s), so
: the GMAT score (in 100s), so ![x\in[2, 8]](https://4mules.nl/wp-content/ql-cache/quicklatex.com-04699d849bc493016fba6551b14c24ab_l3.png "Rendered by QuickLaTeX.com")
The deterministic model suggests a positive linear relation between GMAT and MBA (positive slope  ). The MBA score would be exactly 3.32 if the GMAT score would be 600. On the other hand, if the manager aims to admit only students with an MBA score of 4 or more, he should require a GMAT score of exactly 682 or more.
Because of the lack of unexpected disturbances we have a deterministic model: if you know the GMAT score then you can exactly compute the corresponding MBA score.
This is not what happens in practice.
There are unknown and unforeseen disturbances (such as ‘illness’ (-), ‘lucky’ (+), ‘excellent student’ (+), ‘off-day’ (-), ‘fell in love’ (-), et cetera) which make the MBA score to vary randomly. So, we should use a probabilistic model.
Thus, it would be better to use a probabilistic model:
where  is a normally distributed random variable with
  and a given constant standard deviation
  .
.
The graph of such a model would be a so-called scatter plot: not all points lie on the straight line.
In general the equation of the scatter plot is:
where and are unknown population parameters which have to be estimated using some statistics. If  and
and  are the estimates of and , respectively, then the regression line (the 'best' linear approximation) would look like:

What is defined as the ‘best’ and how and are determined and other details will be explained later.
The following example clarifies some details. The annual bonuses (1,000s dollars) of 6 employees with different years of experience were recorded as below. We wish to determine the regression line.
| Years of experience | Annual bonus |
| 1 | 6 |
| 2 | 1 |
| 3 | 9 |
| 4 | 5 |
| 5 | 17 |
| 6 | 12 |
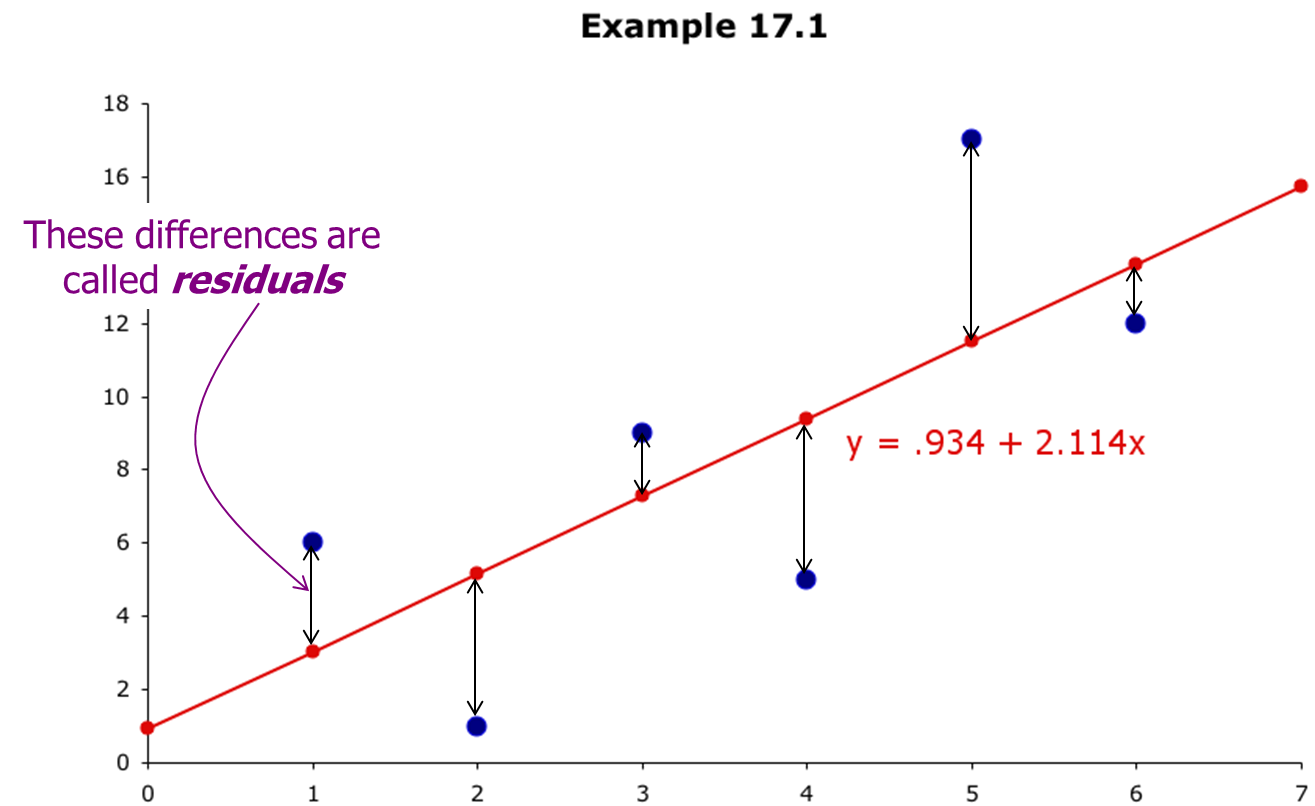
We define the regression line  x as follows. Find and such that the sum of the squared residuals is minimized:

or

This optimization problem is solved by partial differentiation. We find:


How does linear regression work?
We want to explain this with a simple example.
Suppose we have three observations (1,2), (2,1), (3,4) and assume a straight line through the origin (usually not the case, just as an example). Then the regression line should be:

Which  gives the best line?
So, determine such that the following function is minimized with respect to :

This function (parabola) has a minimum for  .
.
So, the regression has a slope 1.143.
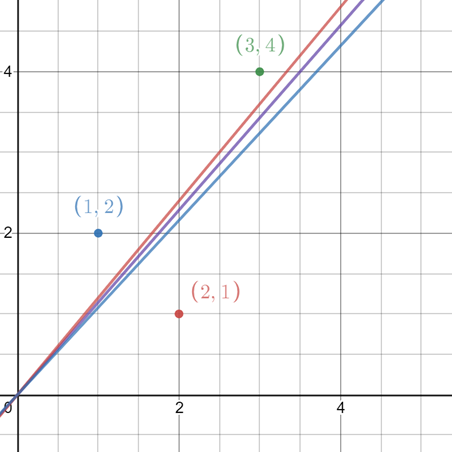
The one in the middle is the (optimal) regression line.
Now the general formula for this case
Minimize with respect to the function:

Solve the derivative with respect to equal to zero (chain rule):

and find:

Note. This is just a simple example showing how the method works. The method for the linear model  is similar, now with 2 independent variables and ,, which requires partial differentiation.