Summary and examples
A simple example of a fractional function is the following:

Naturally, there is the restrictive condition for  :
:

For the value  the function has a vertical asmptote.
There is also a horizontal asymptote. That is the line to which the graph approaches when  or
or  . In this case the graph will approach the line
  , because the fraction will approach
  .
.
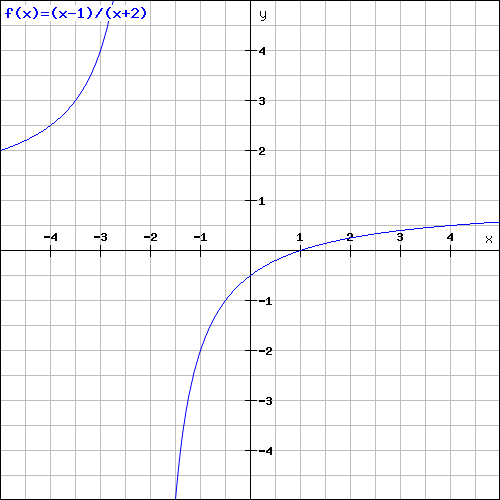
Example 1
As a first example let us take the function with  ,
,  and
and  . The graph is as follows:
In order to sketch the graph, we follow the following steps:
- Determine the vertical asymptote (in this case
 );
); - Determine the horizontal asymptote (in this case
 );
); - Calculate the intersection point with the
 -axis, if it exists;
 - Calculate the intersection point with the
 -axis, if it exists;
Both the vertical and the horizontal asymptote are found quickly. Also the intersection point with the -axis does not cause problems (take  and we find
  ). We find the intersection point with the -axis by solving the following equation:


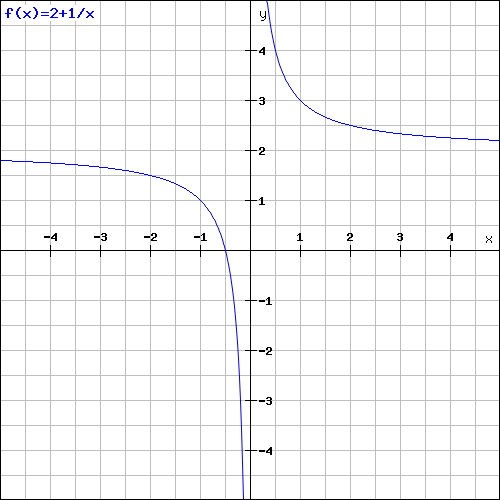
Example 2
Given the function:

and find:
the vertical asymptote;
the horizontal asymptote;
the intersection point with the -axis if it exists;
the intersection point with the -axis if it exists.
Based on these results draw the graph.
We immediately see that the vertical asymptote is (the value for which the denominator equals ); the horizontal asymptote is  (the value to which the graph converges if or
  ); the intersection point with the -axis exists and equals
  (take ); the intersection point with the -axis does not exist because the -axis () is an asymptote.
The graph is depicted in the following figure.
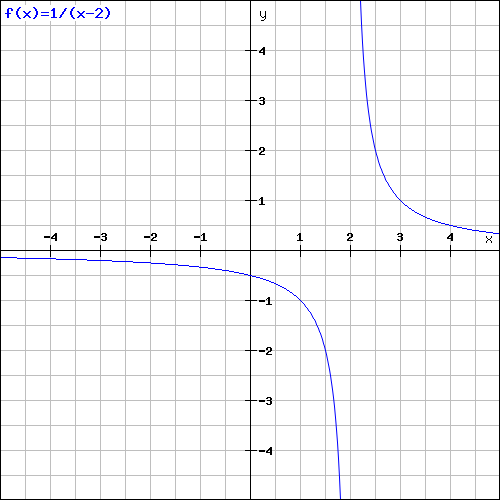
Example 3
Given the function:

and find:
the vertical asymptote;
the horizontal asymptote;
the intersection point with the -axis if it exists;
the intersection point with the -axis if it exists.
Based on these results draw the graph.
When we know the asymptote of  , we also know the asymptote of the function
  .
.
The vertical asymptote is (the -axis); the horizontal asymptote is  (the value of when or ); the intersection point with the -axis does not exist (-axis is an asymptote); the intersection point with the -axis can be calculated from the equation (take ):


The graph is depicted in the following figure:
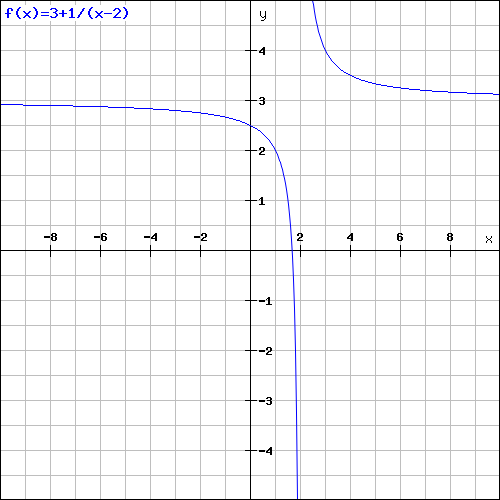
Voorbeeld 4
Given the function:

and find:
the vertical asymptote;
the horizontal asymptote;
the intersection point with the -axis if it exists;
the intersection point with the -axis if it exists.
Based on these results draw the graph.
This function does not have the usual form. Yet it is quite easy to find this usual form. We can rewrite the function as:

We know that this function has the vertical asymptote  , that the horizontal asymptote is
  (because the second term has the asymptote ), that the intersection point with the -axis is:
  en that the intersection point with -axis is
  .
.
The graph is the following.