Summary and examples
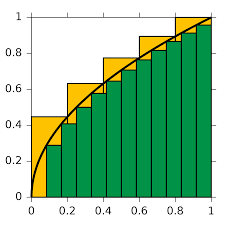
The picture below shows the graph of the function ![]() on the interval
on the interval ![]() (the figure is taken from Wikipedia).
(the figure is taken from Wikipedia).

Suppose we want to calculate the area enclosed by ![]() ,
, ![]() and
and ![]() . Because we (still) do not know how to calculate an area with a curved boundary (in this case
. Because we (still) do not know how to calculate an area with a curved boundary (in this case ![]() ) we could opt for the following approach. We approximate the area by adding the areas of the yellow rectangles:
) we could opt for the following approach. We approximate the area by adding the areas of the yellow rectangles:
![]()
In this way we approximate the area 'from above', because the sum of the areas of the yellow rectangles is larger than the area we want to calculate. We could also take the sum of the green rectangles and then we would approximate the area 'from below'.
However, in both cases the approximation is too rough and thus we could choose a smaller width, e.g. ![]() . Also this approximation is not good enough and therefore we choose a width equal to
. Also this approximation is not good enough and therefore we choose a width equal to ![]() with
with ![]() . That is to say, we take smaller and smaller values for
. That is to say, we take smaller and smaller values for ![]() . Note that taking
. Note that taking ![]() yields an area equal to
yields an area equal to ![]() and that is certainly not correct. The area can be calculated as follows:
and that is certainly not correct. The area can be calculated as follows:
![]()
In this example we have:
![]()
For this complicated formula we write for brevity:
![Rendered by QuickLaTeX.com Area=\displaystyle\lim_{\Delta{x}\rightarrow0}\sum_{\forall{x_{i}}\in[0,1]}f(x_{i})\Delta{x}=\int_{0}^{1}f(x)dx](https://4mules.nl/wp-content/ql-cache/quicklatex.com-63363a531247f90232c4743ae4ce38b1_l3.png)
This shorthand notation is called a definite integral between the limits ![]() and
and ![]() .
. ![]() is the 'infinitely small' version of the very small version of
is the 'infinitely small' version of the very small version of ![]() .
.
In Integration of standard functions we explain how to calculate this definite integral.
In this section we only consider the calculation of areas and conclude from the above that integration can help us. Later we will see that we can use integrals for volumes as well, especially solids of revolution.
Before we proceed with the details of the calculation of areas by integrating, we just finish the integral above.
In Integration of standard functions we see that the primitive function of:
![]()
equals:
![]()
and thus:
![]()
We have to make a few remarks. In the above case, the graph of ![]() and thus the enclosed area lies above the
and thus the enclosed area lies above the ![]() -axis. When the graph of a function graph and thus the enclosed area lie under the
-axis. When the graph of a function graph and thus the enclosed area lie under the ![]() -axis the integral would have given a negative result. For
-axis the integral would have given a negative result. For ![]() is positive, but the successive values
is positive, but the successive values ![]() would all be negative, and thus the integral.
would all be negative, and thus the integral.
Example 1
Calculate the area enclosed by ![]() and the
and the ![]() -axis, between
-axis, between ![]() and
and ![]() .
.

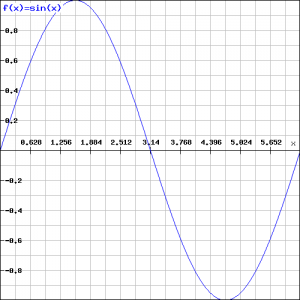
We could have calculated this as follows, but the result might surprise us:
![]()
Of course, this strange result is not correct. It can be explained by the fact that the 'positive' area above the ![]() -axis is compensated by the equal 'negative' area below the
-axis is compensated by the equal 'negative' area below the ![]() -axis.
-axis.
The correct result could be obtained as follows:
![]()
Example 2
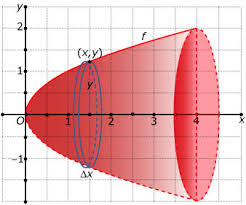
Revolving the graph of ![]() around the
around the ![]() -axis we get a paraboloid (figure from www.math4all.nl). In the figure below we see the surface of revolution, in this case for
-axis we get a paraboloid (figure from www.math4all.nl). In the figure below we see the surface of revolution, in this case for ![]() .
.

How could we calculate the volume of this solid of revolution? We proceed as follows.
Suppose that we draw a circle at a given point ![]() with radius equal to
with radius equal to ![]() . Based on this we construct a cylinder of height
. Based on this we construct a cylinder of height ![]() and then the volume of this cylinder equals
and then the volume of this cylinder equals ![]() . The total volume can be approximated by adding the volumes of all of these small cylinders and next by taking
. The total volume can be approximated by adding the volumes of all of these small cylinders and next by taking ![]() smaller and smaller:
smaller and smaller: ![]() :
:
![Rendered by QuickLaTeX.com Volume=\displaystyle\lim_{\Delta{x}\rightarrow0}\sum_{\forall{x_{i}}\in[0,4]}\pi{y^2}\Delta{x}=\int_{0}^{4}\pi{y^2}dx](https://4mules.nl/wp-content/ql-cache/quicklatex.com-8ec27629080288152903f943d2be540b_l3.png)
In this case we have ![]() and thus we get:
and thus we get:
![]()
When we would have revolved the graph around the ![]() -axis, for example between
-axis, for example between ![]() and
and ![]() , the calculation can be carried out similarly (note that
, the calculation can be carried out similarly (note that ![]() ).
).
![]()
![]()
Example 3
Calculate the volume of the cone with radius ![]() and height
and height ![]() . We know from books that the volume is:
. We know from books that the volume is:
![]()
but how was this result calculated?
The cone is constructed by revolving a straight line around the ![]() -axis. We should take the following line:
-axis. We should take the following line:
![]()
and note that this line goes trough the points ![]() and
and ![]() . Revolving this line around the
. Revolving this line around the ![]() -axis yields the cone: a circle with radius
-axis yields the cone: a circle with radius ![]() and height
and height ![]() .
.
In order to calculate the volume we use the formula:
![]()
For ![]() we have:
we have:
![]()
and thus:
![]()

